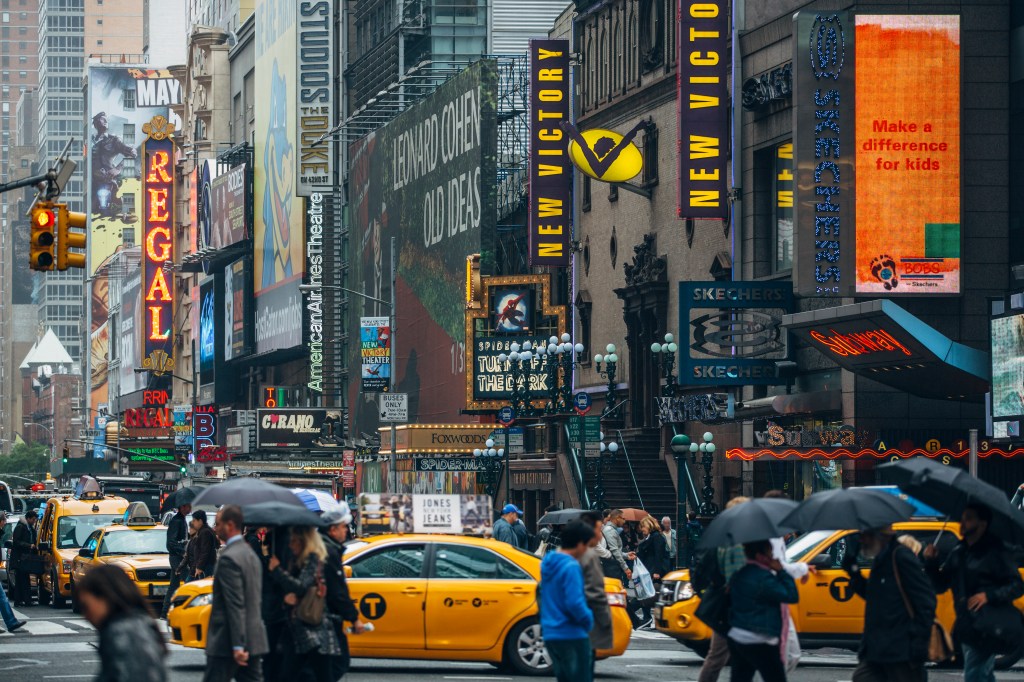
Broadway continued its hard-fought post-Covid rebound last season, according to The Broadway League’s just-released annual 2023-2024 season report.
The report indicates that in the second full season after the financially disastrous shutdown caused by the Covid pandemic, total admissions of 12.3 million rose a slight 0.4% over the 2022-23 season, even as more significant inroads were made in enticing older ticket-buyers back to the theater, and international theatergoers made up the largest proportion of admission since the 2012-2013 season.
Still, the 12.3 million admissions remains considerably lower – 16.8% lower – than the record-breaking pre-Covid season of 2018–2019. The figures are comparable to the Broadway of a decade ago, decent but a long way off from the hugely successful seasons just prior to Covid.
Other findings from the report:
- Approximately 21% of attendances were by people from New York City.
- Thirteen percent of admissions were from the surrounding suburbs, the lowest percentage in thirty years.
- Forty-five percent of attendances were by theatregoers from other areas of the United States.
- The final 21% of admissions were by international visitors. This translated into 2.62 million tickets, the second highest in three decades.
- Sixty-five percent of the audiences identified as women.
- The average age of the Broadway theatregoer was 42 years old. (That’s up from 40 years old the previous season).
- Twenty-eight percent of attendees identified themselves as BIPOC (Black, Indigenous, or People of Color).
- The average annual household income of the Broadway theatregoer was $276,375.
- Respondents reported having paid an average of $154.70 per ticket.
- The average reported date of ticket purchase for a Broadway show was 37 days before the performance, compared to 34 days in the prior year and 47 days in the 2018–2019 season.
- Personal recommendation was the strongest motivating factor in show selection.
The numbers indicate that admissions for most age groups were down slightly, but increases in the 50+ demo were strong enough to offset the dips.
Some other findings in the 68-page report (which is available here):
- Tourists were more likely to attend musicals than plays.
- Locals (theatregoers from New York City and the suburbs) comprised 48.1% of attendees at plays, but 30.7% at musicals.
- Winter saw more NYC suburbanites than other times of the year while New Yorkers were most prevalent in the summer.
- As far as performance time preference, suburbanites preferred weekend matinees.
- International tourists were more likely to attend evening shows over matinees.
- In the 2023–2024 season, 64.8% of the audience self-identified as women. Thirty-two percent identified as men and 3.2% reported that they were non-binary, gender fluid, other identification, or preferred not to say.
- The breakdown of the different gender identities was similar for musicals and plays.
- Twenty-eight percent of admissions were by BIPOC (Black, Indigenous, and People of Color) theatregoers.
- Asian audience members totaled 9.4% of tickets, the highest percentage to date for this group.
- In terms of real numbers, 3.4 million attendances were by BIPOC theatregoers, a decrease from 3.6 million in the previous season.
- The average annual household income of the Broadway theatregoer was approximately $276,375, an inflation-adjusted decrease of about $4,000 from the 2022–2023 season.
- In real dollars, the annual household income in 2023-2024 was approximately $40,000 less than it was in the 2018–2019 season.
- Playgoers were reportedly more affluent than musical attendees, reporting an average annual household income of $290,232 versus $274,229, respectively.
- The typical decision-maker when it comes to purchasing Broadway tickets was a 44-year-old woman, well-educated and a regular theatregoer.
- Playgoers were more apt to respond to particular actors and musical-goers were more likely to give weight to the Tony Awards.

